PythonとPyQtGraphで台形駆動のグラフを描いてみる
2020/05/01 categories:PyQt5| tags:Python|PyQt5|PyQtGraph|Linear motion|
機械設計をしているとモーターを使っている部分の仕様を描く場合に度々台形駆動のグラフを描くことがあります。今まではエクセルで点をたくさんプロットしてグラフを描いていましたが、試しにPythonで書いてみることにしました。
台形駆動のプロット例

GUIの上部に数値を入力してShow graphをクリックすると、入力された値から計算した値がプロットされます。
- acceleration : 加速度
- v_max : 最高速度
- distance : 移動距離
- step : 横軸1区間のプロット数(10としたら加速区間で10点プロットする)
- decimals : 有効数字
三角駆動のプロット例
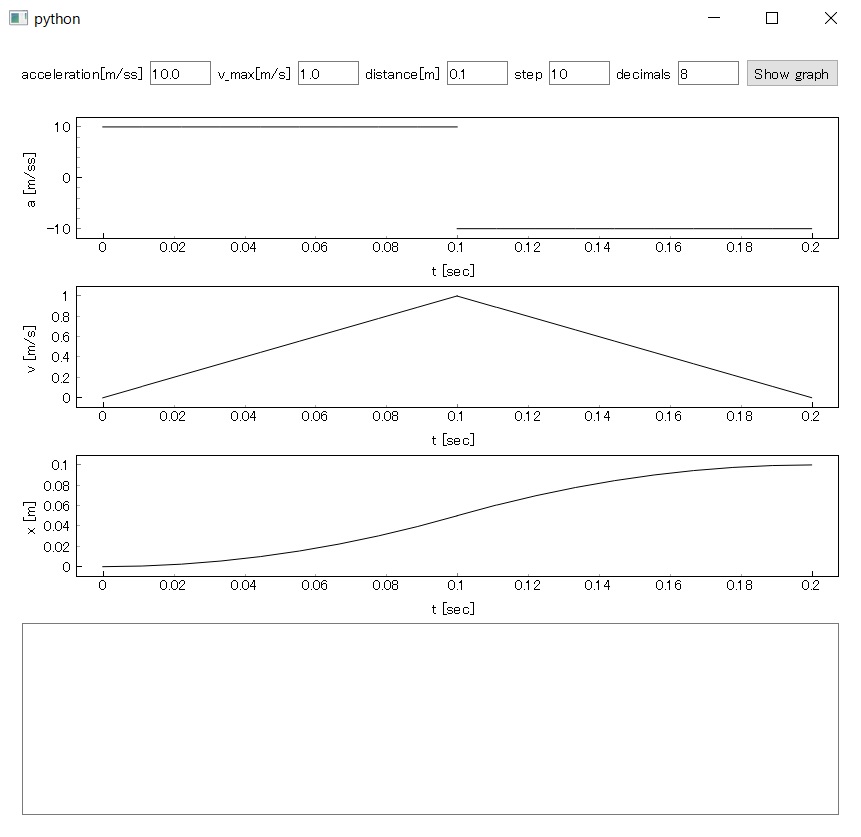
移動距離distanceの半分の距離を等加速度運動したときの速度がv_maxを超える場合は台形駆動、等しいかそれよりも小さい場合は三角駆動として計算するように場合分けしています。
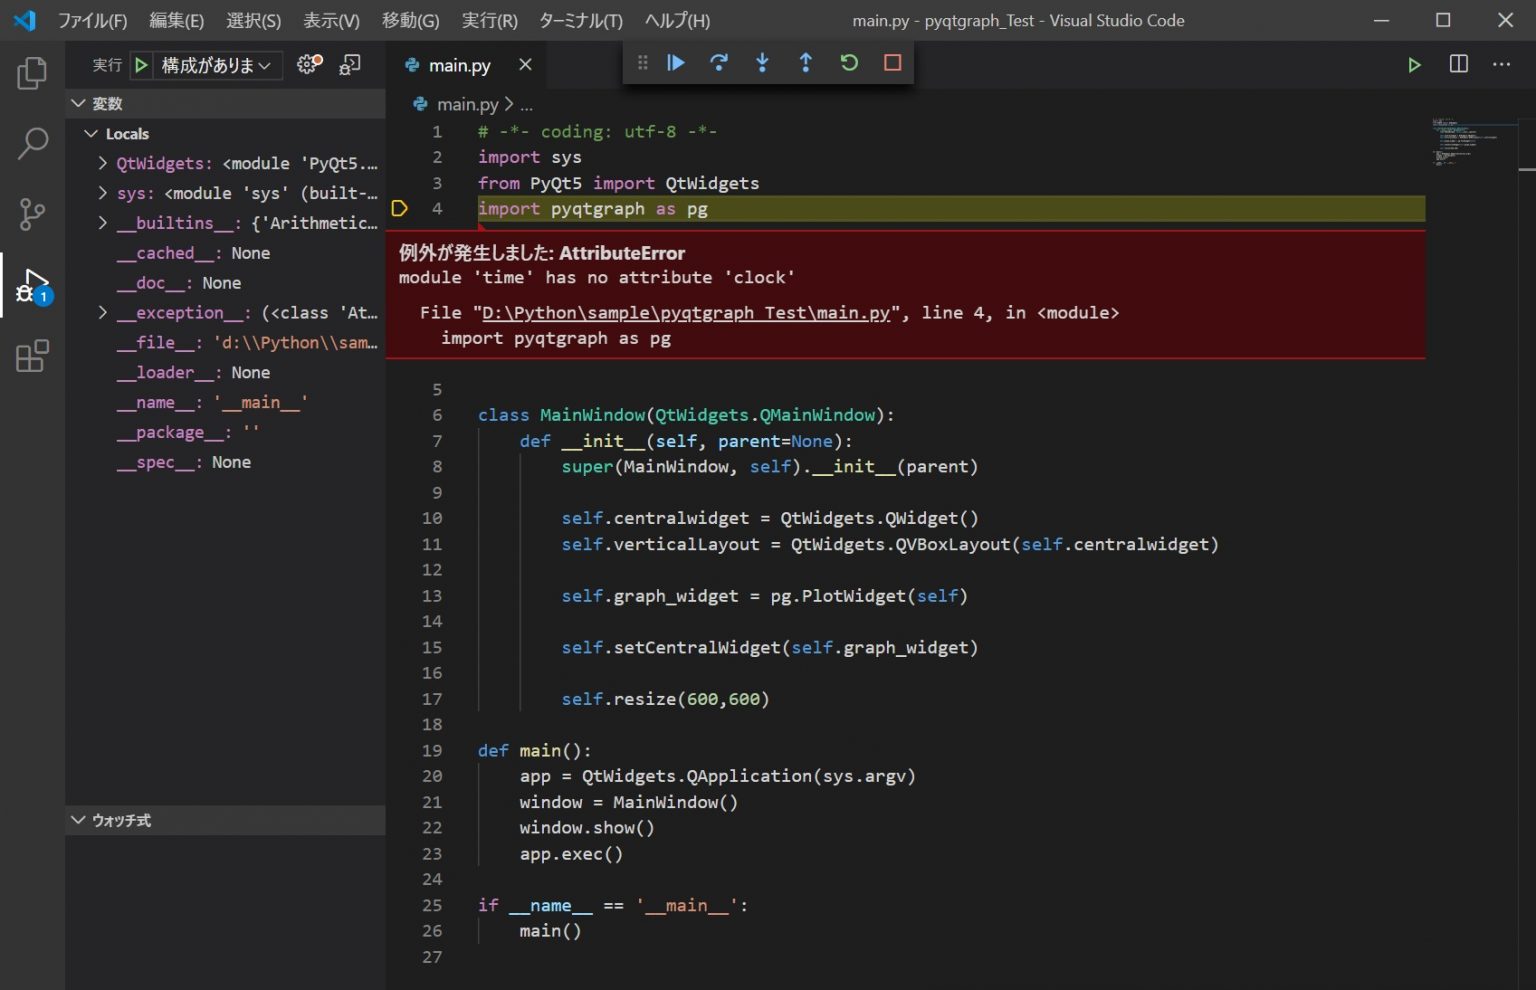
エラー例
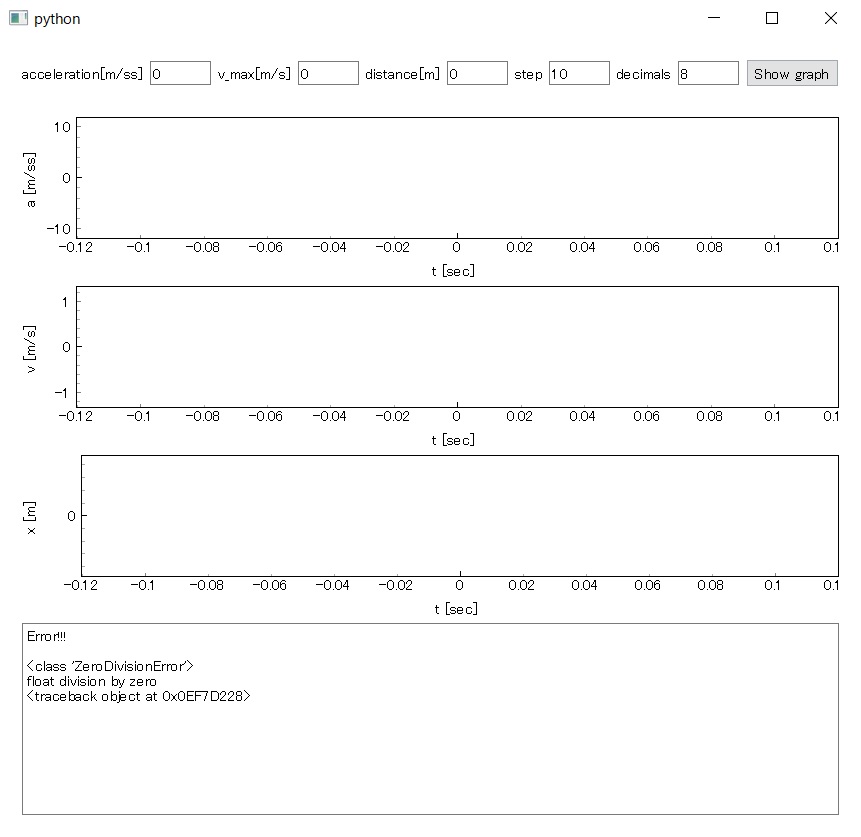
GUI下部のテキストブラウザにエラーが表示されます。例は加速度が0なので、0で割る計算ができないエラーです。
ソースコード
main.pyとmotor_graph.pyを同じフォルダに入れてmain.pyを実行するとGUIが表示されます。実行にはPyQt5、PyQtGraph、Numpyが必要です。
main.py
## -*- coding: utf-8 -*-
import sys
from PyQt5 import QtWidgets, QtCore
import pyqtgraph as pg

from motor_graph import motor_graph

class MainWindow(QtWidgets.QMainWindow):
    def __init__(self, parent=None):
        super(MainWindow, self).__init__(parent)

        # resize window size
        self.resize(600,800)
        self.setStyleSheet("QMainWindow {background: 'white';}")

        # create widgets and layouts
        self.centralwidget = QtWidgets.QWidget()
        self.centralLayout = QtWidgets.QVBoxLayout(self.centralwidget)
        self.setCentralWidget(self.centralwidget)

        # create line edit and button
        self.horizontal_widget = QtWidgets.QWidget()
        self.horizontalLayout = QtWidgets.QHBoxLayout(self.horizontal_widget)
        self.line_edit, self.label = {}, {}
        contents = ['acceleration[m/ss]', 'v_max[m/s]', 'distance[m]', 'step', 'decimals']
        for content in contents:
            self.label[content] = QtWidgets.QLabel(content)
            self.line_edit[content] = QtWidgets.QLineEdit()
            self.horizontalLayout.addWidget(self.label[content])
            self.horizontalLayout.addWidget(self.line_edit[content])
        self.line_edit['acceleration[m/ss]'].setText('10.0')
        self.line_edit['v_max[m/s]'].setText('1.0')
        self.line_edit['distance[m]'].setText('0.3')
        self.line_edit['step'].setText('10')
        self.line_edit['decimals'].setText('8')
        self.button = QtWidgets.QPushButton('Show graph')
        self.button.clicked.connect(self.motor_graph)
        self.horizontalLayout.addWidget(self.button)
        self.centralLayout.addWidget(self.horizontal_widget)

        # create plot widgets
        self.graph_widget_ta = self.plot_widget('t [sec]', 'a [m/ss]')
        self.graph_widget_tv = self.plot_widget('t [sec]', 'v [m/s]')
        self.graph_widget_tx = self.plot_widget('t [sec]', 'x [m]')

        # set plot widgets
        self.vertical_widget = QtWidgets.QWidget()
        self.verticalLayout = QtWidgets.QVBoxLayout(self.vertical_widget)
        self.verticalLayout.addWidget(self.graph_widget_ta)
        self.verticalLayout.addWidget(self.graph_widget_tv)
        self.verticalLayout.addWidget(self.graph_widget_tx)
        self.centralLayout.addWidget(self.vertical_widget)

        # text blowser
        self.text_browser = QtWidgets.QTextBrowser()
        self.verticalLayout.addWidget(self.text_browser)

    def motor_graph(self):
        try:
            self.graph_widget_ta.clear()
            self.graph_widget_tv.clear()
            self.graph_widget_tx.clear()
            acceleration = float( self.line_edit['acceleration[m/ss]'].text() )
            v_max = float( self.line_edit['v_max[m/s]'].text() )
            distance = float( self.line_edit['distance[m]'].text() )
            step = int( self.line_edit['step'].text() )
            decimals = int( self.line_edit['decimals'].text() )
            t, a, v, x = motor_graph(acceleration, v_max, distance, step, decimals)
            pen = pg.mkPen(color='#000000', width=1)
            for ti, ai, vi, xi in zip(t, a, v, x):
                self.graph_widget_ta.addItem( pg.PlotDataItem(x=ti, y=ai, pen=pen, antialias=True) )
                self.graph_widget_tv.addItem( pg.PlotDataItem(x=ti, y=vi, pen=pen, antialias=True) )
                self.graph_widget_tx.addItem( pg.PlotDataItem(x=ti, y=xi, pen=pen, antialias=True) )
        except:
            self.text_browser.setText('Error!!!\n\n' + '\n'.join( [str(i) for i in sys.exc_info()] ))

    def plot_widget(self, label_x, label_y):
        view_box = pg.ViewBox(border=pg.mkPen(color='#000000'))
        pw = pg.PlotWidget(parent=self, background='#FFFFFFFF', viewBox=view_box)

        pi = pw.plotItem
        # set axis label text
        pi.setLabels(bottom=label_x, left = label_y)
        # set x axis color to black
        pi.getAxis('bottom').setPen(pg.mkPen(color='#000000'))
        # set y axis color to black
        pi.getAxis('left').setPen(pg.mkPen(color='#000000'))
        return pw

def main():
    app = QtWidgets.QApplication(sys.argv)
    window = MainWindow()
    window.show()
    app.exec()

if __name__ == '__main__':
    main()
motor_graph.py
## -*- coding: utf-8 -*-
import numpy as np

def uniformly_accelerated_motion(v0, t0, t1, x0, acceleration, steps, decimals=4):
    t = np.round( np.linspace(t0, t1, steps), decimals)
    t_tmp = np.round( np.linspace(0, t1-t0, steps), decimals)
    a = np.round( np.full(steps, acceleration), decimals)
    v = np.round( v0 + a * t_tmp, decimals)
    # x = v0 t + 1/2 a t^2
    x = np.round( v0 * t_tmp + 0.5 * a * t_tmp ** 2 + x0, decimals)
    return t, a, v, x

def uniform_linear_motion(v0, t0, t1, x0, steps, decimals=4):
    t = np.round( np.linspace(t0, t1, steps), decimals)
    t_tmp = np.round( np.linspace(0, t1-t0, steps), decimals)
    a = np.round( np.zeros(steps), decimals)
    v = np.round( np.full(steps, v0), decimals)
    x = np.round( v0 * t_tmp + x0, decimals)
    return t, a, v, x

def motor_graph(acceleration, v_max, distance, step, decimals=4, v0=0):

    # v**2 - v0**2 = 2as   ->   v**2 = 2as - v0**2   ->   v = (2as - v0**2) ** 0.5
    v_tmp = (2.0*acceleration*(distance / 2.0) - v0**2.0) ** 0.5

    if v_tmp <= v_max:
        # 三角駆動
        #v_max2 = round( (v0 ** 2 + 2 * acceleration * distance / 2.0) ** 0.5, 6 )
        t_tmp = round( (v_tmp - v0) / acceleration, decimals )

        # 加速
        t1, a1, v1, x1 = uniformly_accelerated_motion(0.0, 0.0, t_tmp, 0.0, acceleration, step, decimals)

        # 減速
        #t2, a2, v2, x2 = uniformly_accelerated_motion(v_max2, t1[-1], t1[-1] + t1[-1], x1[-1], -1.0*acceleration, step, decimals)
        t2, a2, v2, x2 = uniformly_accelerated_motion(v_tmp, t1[-1], t1[-1] + t1[-1], x1[-1], -1.0*acceleration, step, decimals)

        t = [ t1, t2 ]
        a = [ a1, a2 ]
        v = [ v1, v2 ]
        x = [ x1, x2 ]

    else:
        # 台形駆動
        #t_tmp = (v_max - v0) / acceleration
        t_tmp = round( (v_max - v0) / acceleration, decimals )

        # 加速
        t1, a1, v1, x1 = uniformly_accelerated_motion(
            v0=0.0, t0=0.0, t1=t_tmp, x0=0.0, acceleration=acceleration, steps=step
        )

        # 等速
        # x=at   ->   t=x/a   ->   (distance - x1[-1] * 2) / v_max
        t1_tmp = round( (distance - x1[-1] * 2) / v_max + t1[-1], decimals )
        t2, a2, v2, x2 = uniform_linear_motion(v0=v_max, t0=t1[-1], t1=t1_tmp, x0=x1[-1], steps=step)

        # 減速
        t3, a3, v3, x3 = uniformly_accelerated_motion(v_max, t2[-1], t2[-1] + t1[-1], x2[-1], -1.0*acceleration, step)

        t = [ t1, t2, t3 ]
        a = [ a1, a2, a3 ]
        v = [ v1, v2, v3 ]
        x = [ x1, x2, x3 ]

    return t, a, v, x

def main():
    t, a, v, x = motor_graph(10.0, 1.0, 0.35, 10)

    print('t', t)
    print('a', a)
    print('v', v)
    print('x', x)

if __name__ == '__main__':
    main()