PyQtGraphにRepetierで生成したGコードをプロットしてみた
2021/01/17 categories:PyQtGraph| tags:Python|PyQt5|PyQtGraph|
PyQtGraphにGコードをプロットしてみるプログラムを作ってみました。
PyQtGraphをPyQt5のQMainWindowに表示
PyQtGraphの描画はPyQt5のQMainWindowに行いました。下記のコードのようにGLViewWidgetを使って3Dの散布図を描画します。GLViewWidgetにはGLScatterPlotItemを追加しておいて、追加したGLScatterPlotItemの値を書き換えてGLViewWidgetのプロットを変更するようにしました。
class MainWindow(QtWidgets.QMainWindow):
    def __init__(self, parent=None):
        super(MainWindow, self).__init__(parent)
        self.resize(600, 600)
        self.centralwidget = QtWidgets.QWidget(self)
        self.horizontalLayout = QtWidgets.QHBoxLayout(self.centralwidget)
        self.graph = GLViewWidget(self.centralwidget)
        self.horizontalLayout.addWidget(self.graph)
        self.setCentralWidget(self.centralwidget)

        self.graph.addItem(
            GLScatterPlotItem(
                pos = np.array( [[0, 0, 0]] ),
                size = 0.3,
                color = (0.0, 1.0, 0.0, 1.0),
                pxMode = False
            )
        )

def main():
    app = QtWidgets.QApplication(sys.argv)
    window = MainWindow()
    window.show()
    app.exec()

if __name__ == '__main__':
    main()
Gコードからモデルのプリント部分を抜き出す
Repetierで生成したGコードを眺めていたら、最初の処理、モデルのプリント、最後の処理の3つに分かれていたので、Gコードをそれら3つに分割しました。最初と最後の処理にはM107のコードが2個含まれていて、最初の処理はM107で終わり、最後の処理はM107で始まるという内容だったので、これを基準にGコードを3分割しました。
Gコードを分割する行数は下記コードのm107count(lines)で行い、2回目のM107の行数を分割する行数としています。最初の処理はGコードを通常の順番で2回目のM107を検索して、最後の処理はGコードを逆の順番で2回目のM107を検索するという処理です。
def split_lines(self):
    def m107count(lines):
        count = 0
        for i, line in enumerate(lines):
            key = line.split(' ')[0]
            if key == 'M107':
                count = count + 1
            if count > 1:
                return i

    start = m107count(self.lines) + 1
    end = len(self.lines) - m107count(self.lines[::-1]) - 1

    start_lines = self.lines[:start]
    print_lines = self.lines_to_ndarray(self.lines[start:end])
    end_lines = self.lines[end:]

    return start_lines, print_lines, end_lines
モデルをプリントするGコードから座標を抜き出す
モデルをプリントする部分のGコードはG0とG1の羅列になっていて、G0とG1は下記のようなコードになっています。
G0 Xnnn Ynnn Znnn Ennn Fnnn Snnn
この文字列をスペースで分割して、2個目から後の部分は1文字目だけ分割して1文字目以降を数値として、X、Y、Z、E、F、Sの順に座標のリストにします。その時に、X、Y、Z、E、F、Sのどれかが含まれないことがあるので、その場合は前の座標と同じ座標とするようにしました。また、それらの座標はPyQtGraphで扱いやすいようにNumpyのndarrayとしています。
    def lines_to_ndarray(self, print_lines):
        arr = [[0, 0, 0, 0, 0, 0]]
        keys = []

        for line in print_lines:
            splited = line.split(' ')
            d = { s[0].strip() : float(s[1:]) for s in splited[1:] }
            a = []
            for i, key in enumerate(['X', 'Y', 'Z', 'E', 'F', 'S']):
                if key in d:
                    a.append( d.get(key) )
                else:
                    a.append( arr[-1][i] )
            keys.append( splited[0] )
            arr.append(a)

        return [ keys, np.array(arr[1:]) ]
Gコードから抜き出した座標をPyQtGraphに追加する
抜き出した座標はXYZ以外にも含まれているので、座標からXYZ以外を削除して、この座標をPyQtGraphのGLScatterPlotItemに追加して描画します。
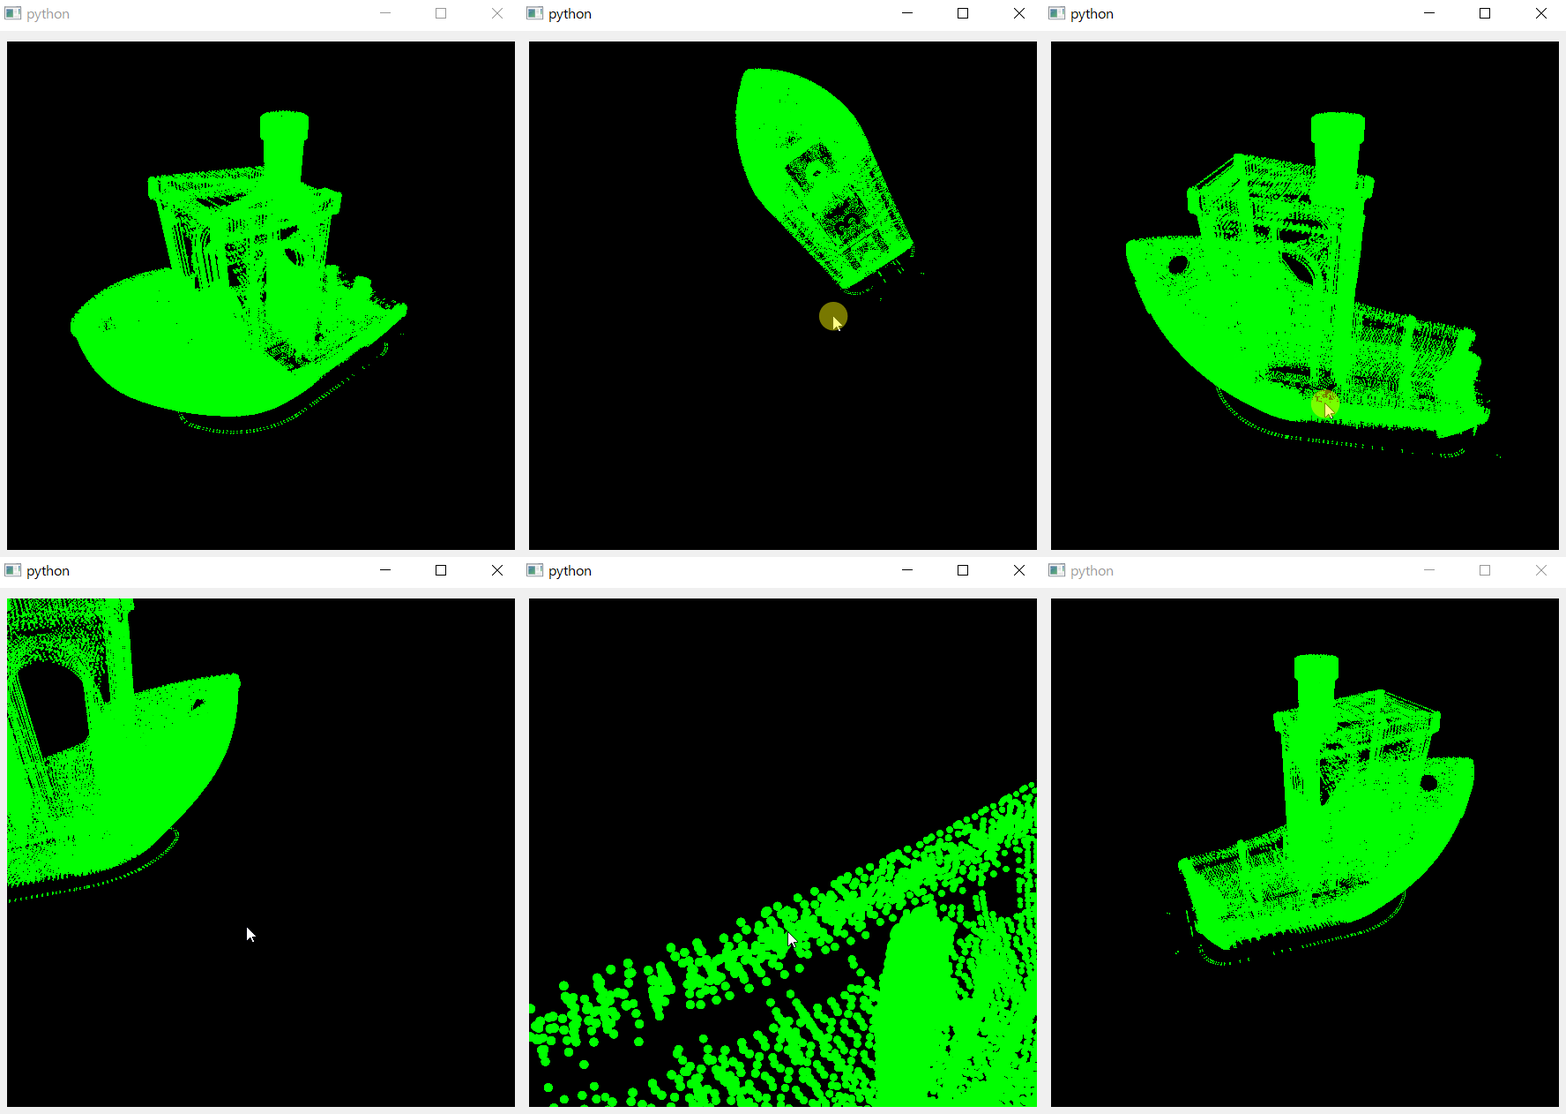
self.graph.items[0].pos = np.delete( self.gcode.print_lines[1], [3, 4, 5], 1 )描画した様子
試しに使用したGコードは3DBenchyをRepetierでGコード化したものです。マウスのドラッグやマウスホイールでビューを変更できます。
ソースコード
main.py
import sys
from PyQt5 import QtWidgets
from pyqtgraph.opengl import GLViewWidget, GLScatterPlotItem
import numpy as np
from gcode import Gcode

class MainWindow(QtWidgets.QMainWindow):
    def __init__(self, parent=None):
        super(MainWindow, self).__init__(parent)

        self.resize(600, 600)

        self.centralwidget = QtWidgets.QWidget(self)
        self.horizontalLayout = QtWidgets.QHBoxLayout(self.centralwidget)
        self.graph = GLViewWidget(self.centralwidget)
        self.horizontalLayout.addWidget(self.graph)
        self.setCentralWidget(self.centralwidget)

        self.graph.addItem(
            GLScatterPlotItem(
                pos = np.array( [[0, 0, 0]] ),
                size = 0.3,
                color = (0.0, 1.0, 0.0, 1.0),
                pxMode = False
            )
        )

        with open('test.gco', 'r') as f:
            self.gcode = Gcode( f.read() )

        self.graph.items[0].pos = np.delete( self.gcode.print_lines[1], [3, 4, 5], 1 )

def main():
    app = QtWidgets.QApplication(sys.argv)
    window = MainWindow()
    window.show()
    app.exec()

if __name__ == '__main__':
    main()
gcode.py
import numpy as np

class Gcode(object):

    def __init__(self, text):
        self.data = []
        self.count = 0
        self.lines = text.split('\n')
        self.start_lines, self.print_lines, self.end_lines = self.split_lines()

    def split_lines(self):
        def m107count(lines):
            count = 0
            for i, line in enumerate(lines):
                key = line.split(' ')[0]
                if key == 'M107':
                    count = count + 1
                if count > 1:
                    return i

        start = m107count(self.lines) + 1
        end = len(self.lines) - m107count(self.lines[::-1]) - 1

        start_lines = self.lines[:start]
        print_lines = self.lines_to_ndarray(self.lines[start:end])
        end_lines = self.lines[end:]

        return start_lines, print_lines, end_lines

    def lines_to_ndarray(self, print_lines):
        arr = [[0, 0, 0, 0, 0, 0]]
        keys = []

        for line in print_lines:
            splited = line.split(' ')
            d = { s[0].strip() : float(s[1:]) for s in splited[1:] }
            a = []
            for i, key in enumerate(['X', 'Y', 'Z', 'E', 'F', 'S']):
                if key in d:
                    a.append( d.get(key) )
                else:
                    a.append( arr[-1][i] )
            keys.append( splited[0] )
            arr.append(a)

        return [ keys, np.array(arr[1:]) ]