CSV files graph list Tool
2021/03/22 categories:TOOL| tags:TOOL|Python|PyQt5|PyQtGraph|
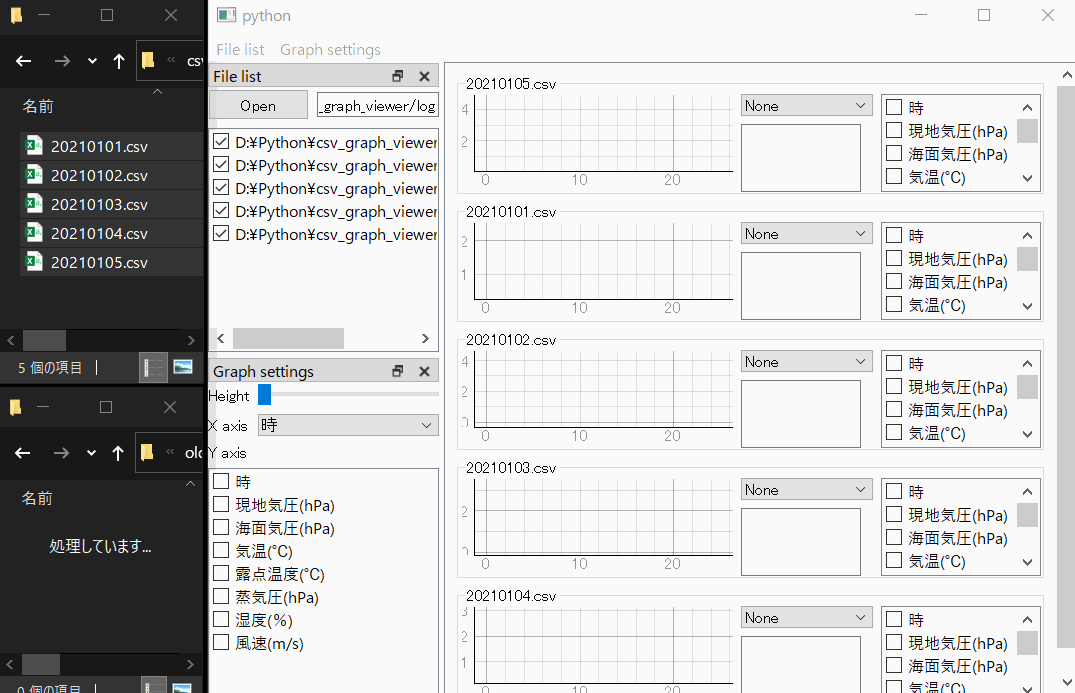
I made a tool to graph CSV files in a folder using PyQtGraph. The CSV file used for the test is the weather data for 5 days.
Function
The implemented functions are as follows. I wanted a tool that monitors the inside of the folder and automatically graphs and displays it when CSV is added, so I made it. I could have made it in Excel, but I thought it would be smarter to make it in PyQt5, so I made it in Python.
- Open folder
- Folder monitoring
- CSV to graph
- Graphs are automatically added when CSV is added in the folder
- Specify the range of the graph to display the maximum and minimum values
- You can specify the columns to be used for the X and Y axes.
Folder monitoring
I diverted the program created by PyQt5 QFileSystemWatcher test and checked the file changes in the folder.As shown in the code below, create a “QFileSystemWatcher” object in your own FileList class, connect “directoryChangedSlot” to the signal of “QFileSystemWatcher.directoryChanged”, and if there is a file change, the FileList class will be " Changed to issue a directoryChanged “signal. In “directoryChangedSlot”, the processing in FileList class is performed, and the directoryChanged signal is used when processing in other classes. In this way, “QFileSystemWatcher” monitors file changes, and when a CSV file is added, it automatically reads the CSV and displays it as a graph.
class FileList(QtWidgets.QWidget):
    directoryChanged = QtCore.pyqtSignal()
    def __init__(self, parent=None, path=None):
        self.fileSystemWatcher = QtCore.QFileSystemWatcher(self)
        self.fileSystemWatcher.directoryChanged.connect(self.directoryChangedSlot)

    def directoryChangedSlot(self, string):
        self.directoryChanged.emit()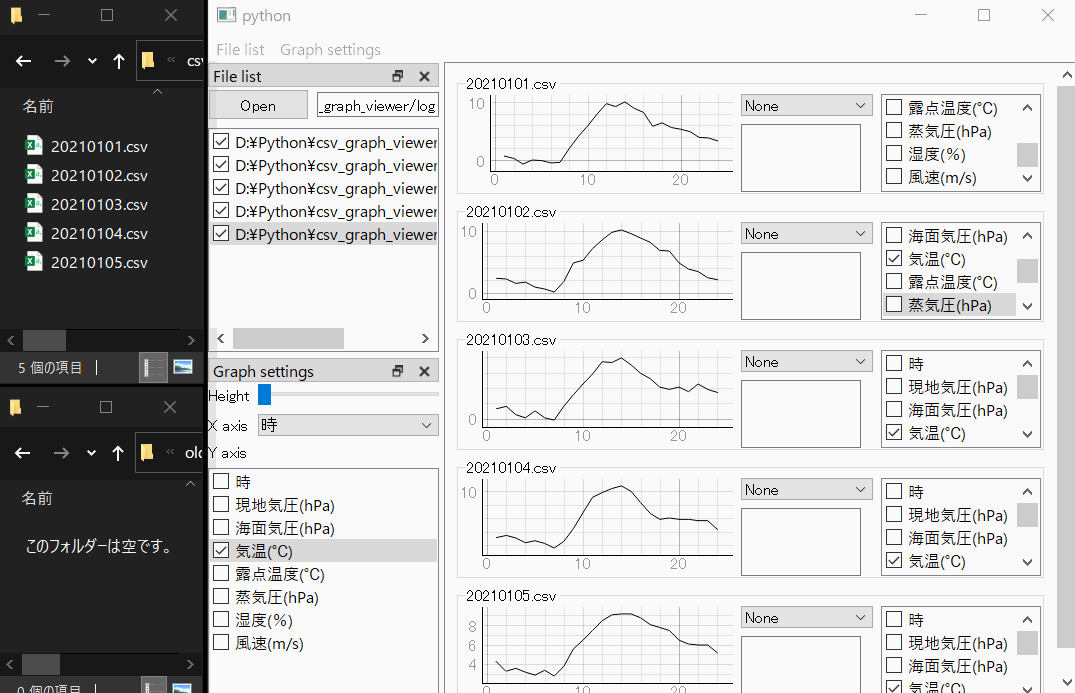
Graph CSV
I read csv with pandas and add it to “PlotWidget” as “PlotDataItem” for each column of “DataFrame” to display the graph. By adding “LinearRegionItem” to “PlotWidget”, the GUI for specifying the range on the graph is displayed. This makes it possible to operate the range with the mouse and display the maximum and minimum values within that range. The object that displays these is a self-made Graph class, so that you can specify the type of Y-axis data to be displayed, display the maximum and minimum values, specify the type of data to specify the range, etc. in addition to displaying the graph. I am creating.
class Graph(QtWidgets.QWidget):
    def __init__(self, parent=None, title=None):
        super(Graph, self).__init__(parent)
        self.plotWidget = pg.PlotWidget(self.groupBox)

    def changeXAxis(self, xKey=''):
        for column in self.df.columns:
            self.plotItem[column] = pg.PlotDataItem(
                x=self.df[self.xKey], y=self.df[column], pen=pg.mkPen(color='#000000', width=1), antialias=True
            )
            self.plotWidget.addItem( self.plotItem[column] )

            linear_region_item = pg.LinearRegionItem(( self.df[self.xKey].min(), self.df[self.xKey].max() ), 'vertical')
            self.plotWidget.addItem(linear_region_item)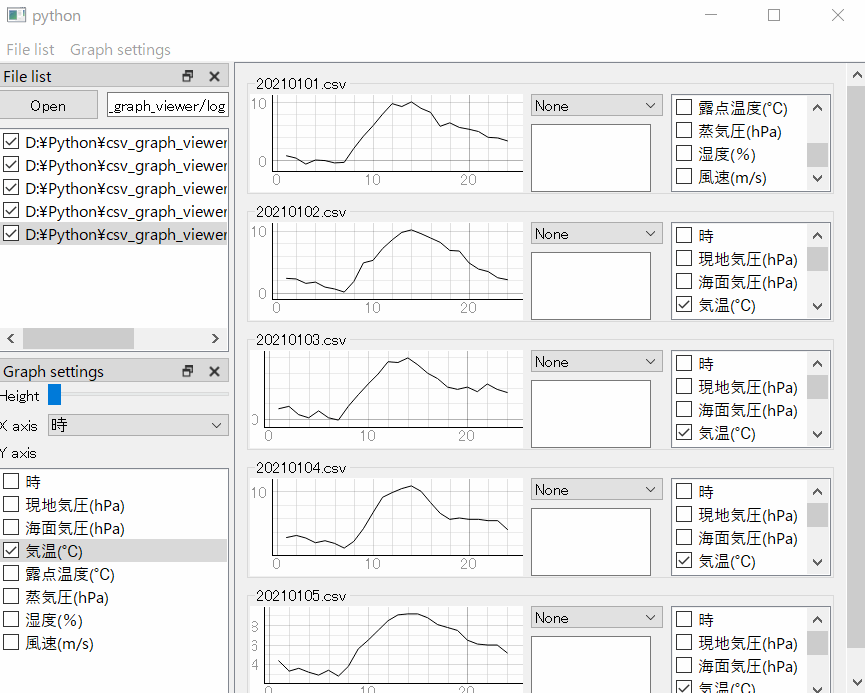
Graphs are automatically added when CSV is added in the folder
The CSV in the folder will be displayed in your own Graph List. QScrollArea is set in this class, and the graph displayed increases as the Graph class is added to QScrollArea with addGraph. When directoryChanged of FileList is issued, MainWindow class, which is the top class, executes directoryChanged and adds Graph by executing addGraph of GraphList.
class MainWindow(QtWidgets.QMainWindow):
    def __init__(self, parent=None):
        super(MainWindow, self).__init__(parent)
        self.fileList.directoryChanged.connect(self.directoryChanged)

    def directoryChanged(self):
        for path in self.fileList.paths():
            graph = self.graphList.addGraph(path, path.name, xKey)

class GraphList(QtWidgets.QWidget):
    def __init__(self, parent=None):
        super(GraphList, self).__init__(parent)
        scrollArea = QtWidgets.QScrollArea(self)
        self.scrollLayout = QtWidgets.QVBoxLayout(self.scrollWidget)
        self.scrollLayout.addItem(spacerItem)

    def addGraph(self, csv_path, title, xKey):
        graph = Graph(self.scrollWidget, title)
        graph.setDataFrame(pd.read_csv(csv_path, encoding=csv_encoding), xKey)
        self.scrollLayout.insertWidget(self.scrollLayout.count() - 1, graph)
Specify the range of the graph to display the maximum and minimum values
LinearRegionItem has been added to PlotWidget so that you can specify the range by operating the mouse. Since the sigRegionChangeFinished signal is issued when this range is changed, we are implementing the process of connecting regionChangeFinished to that signal and getting the maximum and minimum values in the Graph class. You can get the maximum and minimum values of X in the specified range with linear_region_item.getRegion (). In order to obtain the value of Y corresponding to the range of the maximum value and the minimum value of X, first compare the DataSeries of X with the maximum value and the minimum value of X, respectively, and the range of the maximum value and the minimum value is Create a Bool DataSeries that will be True. By specifying the DataSeries of this Bool as the index of the DataSeries of Y, the data of Y within the specified range is acquired. By acquiring the maximum and minimum values of the Y data that was acquired last, the maximum and minimum values of Y that are ranged by X can be acquired. These values are displayed in QPlaneTextEdit so that they can be confirmed on the GUI.
    def regionChangeFinished(self, linear_region_item):
        yKey = self.comboBox.currentText()
        for key in self.linearRegionItem:
            item = self.linearRegionItem[key]
            if not item == linear_region_item:
                continue
            x_min, x_max = linear_region_item.getRegion()
            lower_flags, upper_flags = x_min < self.df[self.xKey], self.df[self.xKey] < x_max
            df_extract = self.df[lower_flags & upper_flags]
            self.y_min, self.y_max = df_extract[yKey].min(), df_extract[yKey].max()
        self.updatePlaneTextEdit()
Specifying the type of Y-axis data to display on the graph
I have set my own CheckList class in the Graph class. This CheckList class is a class with a QListView that displays a list of CheckBoxes. When the check of this CheckBox changes, model.dataChanged is issued, checkListModelDataChanged of Graph is executed, and the display of plotItem is switched depending on the check state of CheckBox. In this process, if you check the checklist, the graph will be displayed.
class Graph(QtWidgets.QWidget):
    def __init__(self, parent=None, title=None):
        super(Graph, self).__init__(parent)
        self.plotItem = {}
        self.checkList = CheckList(self.groupBox)
        self.checkList.model.dataChanged.connect(self.checkListModelDataChanged)

    def checkListModelDataChanged(self, topLeftIndex, bottomRightIndex, roles):
        for item in self.checkList.items():
            self.plotItem.get( item.text() ).setVisible( item.checkState() == QtCore.Qt.Checked )

class CheckList(QtWidgets.QWidget):
    def __init__(self, parent=None, items=[]):
        super(CheckList, self).__init__(parent)
        self.model = QtGui.QStandardItemModel()
        self.layout().addWidget( QtWidgets.QListView(self) )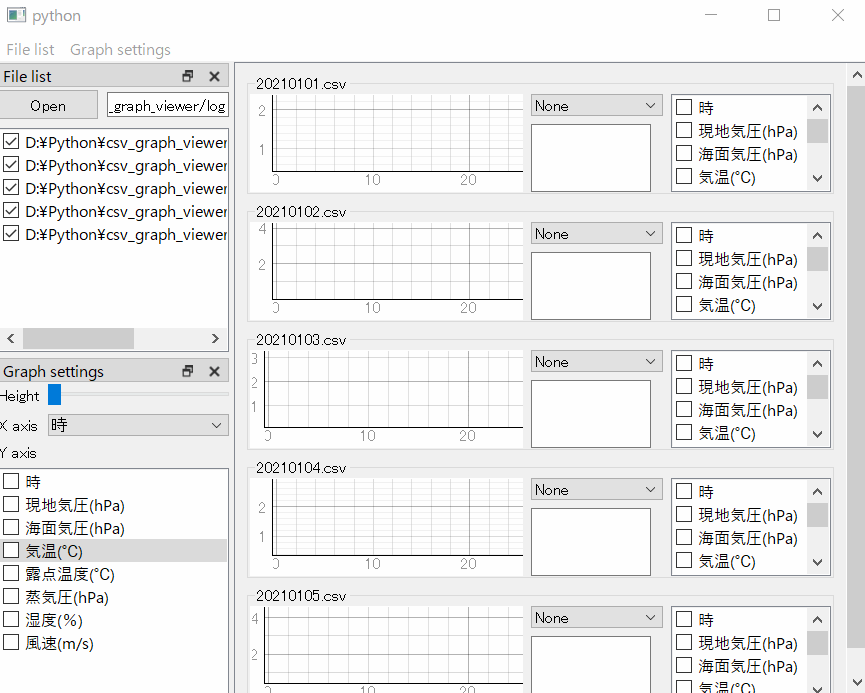
Source code
# -*- coding: utf-8 -*-
import pyqtgraph as pg
import pandas as pd
import sys
from pathlib import Path
from PyQt5 import QtWidgets, QtCore, QtGui

csv_encoding = 'utf-8'

class MainWindow(QtWidgets.QMainWindow):
    def __init__(self, parent=None):
        super(MainWindow, self).__init__(parent)
        self.resize(800, 600)

        self.graphList = GraphList(self)
        self.fileList = FileList()
        self.graphHeightSlider = QtWidgets.QSlider(QtCore.Qt.Horizontal)
        self.graphHeightSlider.setRange(120, 600)
        self.xAxisValues = QtWidgets.QComboBox()
        self.yValueCheckList = CheckList()

        self.setCentralWidget(self.graphList)

        fileListDock = QtWidgets.QDockWidget('File list', self)
        fileListDock.setWidget(self.fileList)

        graphSettingsDock = QtWidgets.QDockWidget('Graph settings', self)
        graphSettingsDock.setWidget( QtWidgets.QWidget(graphSettingsDock) )

        graphSettingsLayout = QtWidgets.QGridLayout( graphSettingsDock.widget() )
        graphSettingsLayout.setContentsMargins(0, 0, 0, 0)
        graphSettingsLayout.addWidget( QtWidgets.QLabel('Height', graphSettingsDock.widget()), 0, 0, 1, 1 )
        graphSettingsLayout.addWidget( QtWidgets.QLabel('X axis', graphSettingsDock.widget()), 1, 0, 1, 1 )
        graphSettingsLayout.addWidget( QtWidgets.QLabel('Y axis', graphSettingsDock.widget()), 2, 0, 1, 1 )
        graphSettingsLayout.addWidget( self.graphHeightSlider, 0, 1, 1, 1 )
        graphSettingsLayout.addWidget( self.xAxisValues,       1, 1, 1, 1 )
        graphSettingsLayout.addWidget( self.yValueCheckList,   3, 0, 1, 2 )

        self.graphHeightSlider.setParent( graphSettingsDock.widget() )
        self.xAxisValues.setParent( graphSettingsDock.widget() )
        self.yValueCheckList.setParent( graphSettingsDock.widget() )

        self.addDockWidget(QtCore.Qt.DockWidgetArea(1), fileListDock)
        self.addDockWidget(QtCore.Qt.DockWidgetArea(1), graphSettingsDock)

        self.menuBar().addAction( fileListDock.toggleViewAction() )
        self.menuBar().addAction( graphSettingsDock.toggleViewAction() )

        self.graphHeightSlider.valueChanged.connect(self.sliderChanged)
        self.fileList.directoryChanged.connect(self.directoryChanged)
        self.fileList.checkListChanged.connect(self.fileListStateChanged)
        self.xAxisValues.currentTextChanged.connect(self.xAxisValuesChanged)
        self.yValueCheckList.model.dataChanged.connect(self.checkListModelDataChanged)

    def checkListModelDataChanged(self, topLeftIndex, bottomRightIndex, roles):
        key_and_state_dict = {}
        for item in self.yValueCheckList.items():
            key_and_state_dict[item.text()] = item.checkState()
        self.graphList.setCheckStates(key_and_state_dict)

    def directoryChanged(self):
        filenames = [ path.name for path in self.fileList.paths() ]
        graph_titles = self.graphList.titles()

        for graph_title in graph_titles:
            if not graph_title in filenames:
                self.graphList.deleteGraph(graph_title)

        graph_titles = self.graphList.titles()
        xKey = self.xAxisValues.currentText()
        checkItems = []

        for path in self.fileList.paths():
            if path.name in graph_titles:
                graph = self.graphList.getGraph(path.name)
            else:
                graph = self.graphList.addGraph(path, path.name, xKey)
            graph.setHeight( self.graphHeightSlider.value() )
            for item in graph.checkList.items():
                if not item.text() in checkItems:
                    checkItems.append( item.text() )

        self.yValueCheckList.setItems(checkItems, QtCore.Qt.Unchecked)
        self.xAxisValues.clear()
        self.xAxisValues.addItems(checkItems)

    def fileListStateChanged(self, itemText, state):
        self.graphList.changeGraphVisible(itemText, state == QtCore.Qt.Checked)

    def sliderChanged(self, value):
        for graph in self.graphList.graphs():
            graph.setHeight(value)

    def xAxisValuesChanged(self, text):
        for graph in self.graphList.graphs():
            graph.changeXAxis(text)

class GraphList(QtWidgets.QWidget):
    def __init__(self, parent=None):
        super(GraphList, self).__init__(parent)
        layout = QtWidgets.QVBoxLayout(self)
        scrollArea = QtWidgets.QScrollArea(self)
        spacerItem = QtWidgets.QSpacerItem(20, 40, QtWidgets.QSizePolicy.Minimum, QtWidgets.QSizePolicy.Expanding)
        self.scrollWidget = QtWidgets.QWidget(self)
        self.scrollLayout = QtWidgets.QVBoxLayout(self.scrollWidget)

        layout.setContentsMargins(0, 0, 0, 0)
        scrollArea.setWidgetResizable(True)
        scrollArea.setWidget(self.scrollWidget)
        layout.addWidget(scrollArea)
        self.scrollLayout.addItem(spacerItem)

    def addGraph(self, csv_path, title, xKey):
        graph = Graph(self.scrollWidget, title)
        graph.setDataFrame(pd.read_csv(csv_path, encoding=csv_encoding), xKey)
        self.scrollLayout.insertWidget(self.scrollLayout.count() - 1, graph)
        return graph

    def deleteGraph(self, title):
        if not self.getGraph(title) is None:
            self.getGraph(title).deleteLater()

    def getGraph(self, title):
        for graph in self.graphs():
            if title == graph.title():
                return graph
        return None

    def graphs(self):
        return [
            self.scrollLayout.itemAt(c).widget()
            for c in range( self.scrollLayout.count() )
            if type(self.scrollLayout.itemAt(c).widget()) is Graph
        ]

    def changeGraphVisible(self, title, isVisivle):
        graph = self.getGraph(title)
        if not graph is None:
            graph.setVisible(isVisivle)

    def setCheckStates(self, key_and_state_dict):
        for graph in self.graphs():
            graph.setCheckStates(key_and_state_dict)

    def titles(self):
        return [ graph.groupBox.title() for graph in self.graphs() ]

class FileList(QtWidgets.QWidget):
    directoryChanged = QtCore.pyqtSignal()
    checkListChanged = QtCore.pyqtSignal(str, int)
    def __init__(self, parent=None, path=None):
        super(FileList, self).__init__(parent)
        self.setLayout( QtWidgets.QVBoxLayout(self) )
        self.layout().setContentsMargins(0, 0, 0, 0)
        widget = QtWidgets.QWidget(self)
        self.layout().addWidget(widget)
        self.checkList = CheckList(self)
        self.layout().addWidget(self.checkList)
        layout = QtWidgets.QHBoxLayout(widget)
        widget.setLayout(layout)
        layout.setContentsMargins(0, 0, 0, 0)
        button = QtWidgets.QPushButton('Open', widget)
        layout.addWidget(button)
        self.lineEdit =  QtWidgets.QLineEdit(widget)
        layout.addWidget(self.lineEdit)

        self.fileSystemWatcher = QtCore.QFileSystemWatcher(self)
        self.lineEdit.textChanged.connect(self.lineEditChanged)
        self.fileSystemWatcher.directoryChanged.connect(self.directoryChangedSlot)
        self.checkList.model.dataChanged.connect(self.checkListModelDataChanged)
        button.clicked.connect(self.folderOpen)

        if not path is None:
            self.lineEditChanged(path)
            self.lineEdit.setText(path)

    def checkListModelDataChanged(self, topLeftIndex, bottomRightIndex, roles):
        model, row = topLeftIndex.model(), topLeftIndex.row()
        filename = Path( model.item(row).text() ).name
        self.checkListChanged.emit( filename, model.item(row).checkState() )

    def directoryChangedSlot(self, string):
        self.checkList.setItems( Path(string).glob('*.csv'), QtCore.Qt.Checked )
        self.directoryChanged.emit()

    def folderOpen(self):
        return_value = QtWidgets.QFileDialog.getExistingDirectory(None, 'Open folder', '')
        if not return_value == '':
            self.lineEdit.setText(return_value)

    def lineEditChanged(self, text):
        path = Path(text)
        for d in self.fileSystemWatcher.directories():
            self.fileSystemWatcher.removePath(d)
        if not path.exists():
            return
        self.checkList.setItems( path.glob('*.csv'), QtCore.Qt.Checked )
        self.fileSystemWatcher.addPath(text)
        self.directoryChanged.emit()

    def paths(self):
        return [ Path( item.text() ) for item in self.checkList.items() ]

class Graph(QtWidgets.QWidget):
    def __init__(self, parent=None, title=None):
        super(Graph, self).__init__(parent)
        self.df, self.y_min, self.y_max = None, 0, 0
        self.linearRegionItem = {}
        self.plotItem = {}
        self.setLayout( QtWidgets.QVBoxLayout(self) )

        self.groupBox = QtWidgets.QGroupBox(title, self)
        self.layout().addWidget( self.groupBox )
        self.layout().setContentsMargins(0, 0, 0, 0)

        groupBoxLayout = QtWidgets.QGridLayout(self.groupBox)
        groupBoxLayout.setContentsMargins(2, 2, 2, 2)
        self.groupBox.setLayout( groupBoxLayout )

        self.plotWidget = pg.PlotWidget(self.groupBox)
        self.plotWidget.setBackground('#FFFFFFFF')
        self.plotWidget.plotItem.getAxis('bottom').setPen(pg.mkPen(color='#000000'))
        self.plotWidget.plotItem.getAxis('left').setPen(pg.mkPen(color='#000000'))
        self.plotWidget.plotItem.showGrid(True, True, 0.3)

        self.comboBox = QtWidgets.QComboBox(self.groupBox)
        self.comboBox.addItem('None')

        self.planeTextEdit = QtWidgets.QPlainTextEdit(self.groupBox)
        self.planeTextEdit.setMaximumWidth(120)

        self.checkList = CheckList(self.groupBox)
        self.checkList.setMaximumWidth(160)

        groupBoxLayout.addWidget(self.plotWidget, 0, 0, 2, 1)
        groupBoxLayout.addWidget(self.comboBox, 0, 1, 1, 1)
        groupBoxLayout.addWidget(self.planeTextEdit, 1, 1, 1, 1)
        groupBoxLayout.addWidget(self.checkList, 0, 2, 2, 1)

        self.comboBox.currentTextChanged.connect(self.comboBoxCurrentTextChanged)
        self.checkList.model.dataChanged.connect(self.checkListModelDataChanged)

    def changeXAxis(self, xKey=''):
        self.linearRegionItem = {}
        self.plotItem = {}
        self.plotWidget.plotItem.clear()

        self.xKey = xKey
        if xKey == '':
            self.xKey = self.df.columns[0]

        for column in self.df.columns:
            if self.df[column].dtype.kind == 'O':
                continue

            if not self.xKey in self.df.columns:
                continue

            self.plotItem[column] = pg.PlotDataItem(
                x=self.df[self.xKey], y=self.df[column], pen=pg.mkPen(color='#000000', width=1), antialias=True
            )
            self.plotWidget.addItem( self.plotItem[column] )
            self.plotItem[column].hide()

            linear_region_item = pg.LinearRegionItem(( self.df[self.xKey].min(), self.df[self.xKey].max() ), 'vertical')
            self.plotWidget.addItem(linear_region_item)
            linear_region_item.sigRegionChangeFinished.connect(self.regionChangeFinished)
            self.linearRegionItem[column] = linear_region_item
            self.linearRegionItem[column].hide()

            self.comboBox.addItem(column)

        self.checkListModelDataChanged(None, None, None)

    def checkListModelDataChanged(self, topLeftIndex, bottomRightIndex, roles):
        for item in self.checkList.items():
            plotItem = self.plotItem.get( item.text() )
            if plotItem is None:
                continue
            plotItem.setVisible( item.checkState() == QtCore.Qt.Checked )

        viewBox = [ item for item in self.plotWidget.items() if type(item) is pg.graphicsItems.ViewBox.ViewBox ]
        if len(viewBox) > 0:
            viewBox[0].updateAutoRange()

    def comboBoxCurrentTextChanged(self, text):
        for key in self.linearRegionItem:
            self.linearRegionItem[key].setVisible(key == text)

        if text == 'None':
            self.planeTextEdit.setPlainText('')
            return

        self.updatePlaneTextEdit()

    def regionChangeFinished(self, linear_region_item):
        yKey = self.comboBox.currentText()
        for key in self.linearRegionItem:
            item = self.linearRegionItem[key]
            if not item == linear_region_item:
                continue
            x_min, x_max = linear_region_item.getRegion()
            lower_flags, upper_flags = x_min < self.df[self.xKey], self.df[self.xKey] < x_max
            df_extract = self.df[lower_flags & upper_flags]
            self.y_min, self.y_max = df_extract[yKey].min(), df_extract[yKey].max()
        self.updatePlaneTextEdit()

    def setCheckStates(self, key_and_state_dict):
        for key in key_and_state_dict:
            item_texts = [ item.text() for item in self.checkList.items() ]
            if not key in item_texts:
                continue
            row = item_texts.index(key)
            self.checkList.setCheckState(row, key_and_state_dict[key])

    def setDataFrame(self, df, xKey):
        self.df, self.xKey = df, xKey
        self.changeXAxis(self.xKey)
        self.checkList.setItems(list(self.df.columns), QtCore.Qt.Unchecked)
        self.comboBoxCurrentTextChanged( self.comboBox.currentText() )

    def setHeight(self, value):
        self.groupBox.setMinimumHeight(value)
        self.groupBox.setMaximumHeight(value)

    def title(self):
        return self.groupBox.title()

    def updatePlaneTextEdit(self):
        key = self.comboBox.currentText()
        x_min, x_max = self.linearRegionItem[key].getRegion()
        df_extract = self.df[ (x_min < self.df[self.xKey]) & (self.df[self.xKey] < x_max) ]
        self.y_min, self.y_max = df_extract[key].min(), df_extract[key].max()
        plainText  = key + '\n'
        plainText += 'max : ' + str( round(self.y_max, 9) ) + '\n'
        plainText += 'min : ' + str( round(self.y_min, 9) )
        self.planeTextEdit.setPlainText(plainText)

class CheckList(QtWidgets.QWidget):
    def __init__(self, parent=None, items=[]):
        super(CheckList, self).__init__(parent)
        self.model = QtGui.QStandardItemModel()
        self.setLayout( QtWidgets.QVBoxLayout(self) )
        self.layout().setContentsMargins(0, 0, 0, 0)
        self.layout().addWidget( QtWidgets.QListView(self) )
        self.layout().itemAt(0).widget().setModel(self.model)
        self.setItems(items, QtCore.Qt.Unchecked)

    def item(self, row, column=0):
        return self.model.item(row, column)

    def items(self):
        return [ self.model.item(r) for r in range( self.model.rowCount() ) ]

    def setCheckState(self, row, state):
        self.model.item(row).setCheckState(state)

    def setItems(self, string_list, state):
        self.model.clear()
        for string in string_list:
            item = QtGui.QStandardItem( str(string) )
            item.setCheckable(True)
            item.setCheckState(state)
            self.model.appendRow(item)

def main():
    app = QtWidgets.QApplication(sys.argv)
    window = MainWindow()
    window.show()
    app.exec()

if __name__ == '__main__':
    main()