Plot G code made by Repetier in PyQtGraph
2021/01/17 categories:PyQtGraph| tags:Python|PyQt5|PyQtGraph|
I made a program to plot G code on PyQtGraph.
Display PyQtGraph in QMainWindow of PyQt5
Drawing of PyQtGraph was done in QMainWindow of PyQt5. Draw a 3D scatter plot using GLViewWidget as shown in the code below. GLScatterPlotItem was added to GLViewWidget, and the value of the added GLScatterPlotItem was rewritten to change the plot of GLViewWidget.
class MainWindow(QtWidgets.QMainWindow):
    def __init__(self, parent=None):
        super(MainWindow, self).__init__(parent)
        self.resize(600, 600)
        self.centralwidget = QtWidgets.QWidget(self)
        self.horizontalLayout = QtWidgets.QHBoxLayout(self.centralwidget)
        self.graph = GLViewWidget(self.centralwidget)
        self.horizontalLayout.addWidget(self.graph)
        self.setCentralWidget(self.centralwidget)

        self.graph.addItem(
            GLScatterPlotItem(
                pos = np.array( [[0, 0, 0]] ),
                size = 0.3,
                color = (0.0, 1.0, 0.0, 1.0),
                pxMode = False
            )
        )

def main():
    app = QtWidgets.QApplication(sys.argv)
    window = MainWindow()
    window.show()
    app.exec()

if __name__ == '__main__':
    main()
Extract the printed part of the model from the G code
When I was looking at the G code generated by Repetier, it was divided into three parts: the first process, the model print, and the last process, so I split the G code into these three. The first and last processes contained two M107 codes, the first process ended with M107, and the last process started with M107, so I divided the G code into three based on this. ..
The number of lines to divide the G code is m107count (lines) of the following code, and the number of lines to divide the second M107 is the number of lines to divide. The first process is to search the G code for the second M107 in the normal order, and the last process is to search the G code for the second M107 in the reverse order.
def split_lines(self):
    def m107count(lines):
        count = 0
        for i, line in enumerate(lines):
            key = line.split(' ')[0]
            if key == 'M107':
                count = count + 1
            if count > 1:
                return i

    start = m107count(self.lines) + 1
    end = len(self.lines) - m107count(self.lines[::-1]) - 1

    start_lines = self.lines[:start]
    print_lines = self.lines_to_ndarray(self.lines[start:end])
    end_lines = self.lines[end:]

    return start_lines, print_lines, end_lines
Extract the coordinates from the G code to print the model
The G code of the part to print the model is a list of G0 and G1, and G0 and G1 are the following codes.
G0 Xnnn Ynnn Znnn Ennn Fnnn Snnn
Divide this character string with a space, divide the second and subsequent parts by only the first character, and make the first and subsequent characters numerical values, and make a list of coordinates in the order of X, Y, Z, E, F, S. I will. At that time, any of X, Y, Z, E, F, S may not be included, so in that case I tried to use the same coordinates as the previous coordinates. Also, those coordinates are Numpy’s ndarray for easy handling in PyQtGraph.
    def lines_to_ndarray(self, print_lines):
        arr = [[0, 0, 0, 0, 0, 0]]
        keys = []

        for line in print_lines:
            splited = line.split(' ')
            d = { s[0].strip() : float(s[1:]) for s in splited[1:] }
            a = []
            for i, key in enumerate(['X', 'Y', 'Z', 'E', 'F', 'S']):
                if key in d:
                    a.append( d.get(key) )
                else:
                    a.append( arr[-1][i] )
            keys.append( splited[0] )
            arr.append(a)

        return [ keys, np.array(arr[1:]) ]
Add the coordinates extracted from the G code to PyQtGraph
Since the extracted coordinates are included in addition to XYZ, delete the coordinates other than XYZ and add these coordinates to GLScatterPlotItem of PyQtGraph to draw.
self.graph.items[0].pos = np.delete( self.gcode.print_lines[1], [3, 4, 5], 1 )How it was drawn
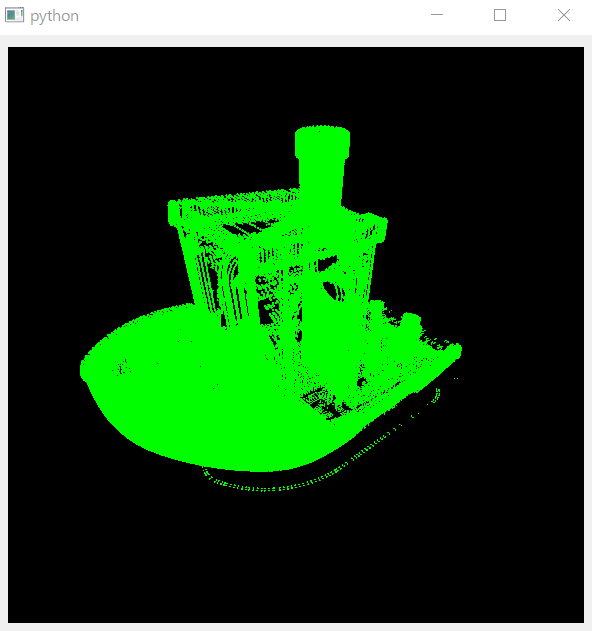
The G code used for the trial is 3D Benchy G-coded with Repeater. You can change the view by dragging the mouse or using the mouse wheel.
Source code
main.py
import sys
from PyQt5 import QtWidgets
from pyqtgraph.opengl import GLViewWidget, GLScatterPlotItem
import numpy as np
from gcode import Gcode

class MainWindow(QtWidgets.QMainWindow):
    def __init__(self, parent=None):
        super(MainWindow, self).__init__(parent)

        self.resize(600, 600)

        self.centralwidget = QtWidgets.QWidget(self)
        self.horizontalLayout = QtWidgets.QHBoxLayout(self.centralwidget)
        self.graph = GLViewWidget(self.centralwidget)
        self.horizontalLayout.addWidget(self.graph)
        self.setCentralWidget(self.centralwidget)

        self.graph.addItem(
            GLScatterPlotItem(
                pos = np.array( [[0, 0, 0]] ),
                size = 0.3,
                color = (0.0, 1.0, 0.0, 1.0),
                pxMode = False
            )
        )

        with open('test.gco', 'r') as f:
            self.gcode = Gcode( f.read() )

        self.graph.items[0].pos = np.delete( self.gcode.print_lines[1], [3, 4, 5], 1 )

def main():
    app = QtWidgets.QApplication(sys.argv)
    window = MainWindow()
    window.show()
    app.exec()

if __name__ == '__main__':
    main()
gcode.py
import numpy as np

class Gcode(object):

    def __init__(self, text):
        self.data = []
        self.count = 0
        self.lines = text.split('\n')
        self.start_lines, self.print_lines, self.end_lines = self.split_lines()

    def split_lines(self):
        def m107count(lines):
            count = 0
            for i, line in enumerate(lines):
                key = line.split(' ')[0]
                if key == 'M107':
                    count = count + 1
                if count > 1:
                    return i

        start = m107count(self.lines) + 1
        end = len(self.lines) - m107count(self.lines[::-1]) - 1

        start_lines = self.lines[:start]
        print_lines = self.lines_to_ndarray(self.lines[start:end])
        end_lines = self.lines[end:]

        return start_lines, print_lines, end_lines

    def lines_to_ndarray(self, print_lines):
        arr = [[0, 0, 0, 0, 0, 0]]
        keys = []

        for line in print_lines:
            splited = line.split(' ')
            d = { s[0].strip() : float(s[1:]) for s in splited[1:] }
            a = []
            for i, key in enumerate(['X', 'Y', 'Z', 'E', 'F', 'S']):
                if key in d:
                    a.append( d.get(key) )
                else:
                    a.append( arr[-1][i] )
            keys.append( splited[0] )
            arr.append(a)

        return [ keys, np.array(arr[1:]) ]