Recognize cells from a table with Open CV and display the recognition result in QGraphicsView of PyQt5
2020/10/12 categories:PyQt5| tags:Python|PyQt5|Open CV|
Updated as OCR_Tool_Rev1. 2021/4/6
A program that recognizes cells from the image in which the table is written using Open CV, displays the cell area or the character string area contained in the cell in the QGraphicsView of PyQt5, and displays the image for each cell in the QTableView. is created.
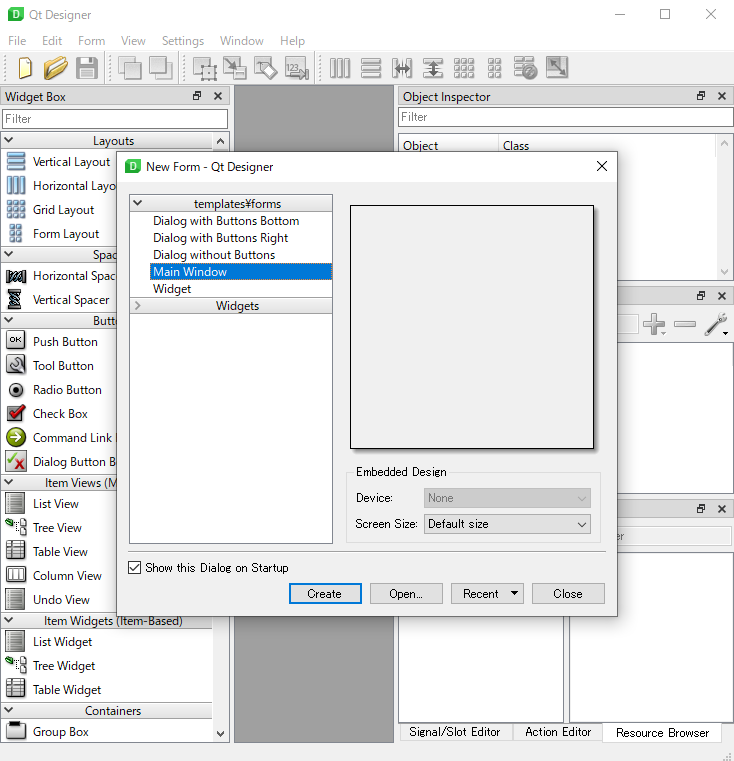
Open image
Click Open files to select a file to load the image, and click a table cell to display the loaded image.
It is read by QtGui.QPixmap.
QtGui.QPixmap(filename)Confirmation of cell recognition
Click Recognition to perform table recognition and display the recognition results. The area recognized as a cell is displayed in a red frame, and you can check the recognized part with Back or Next in the list on the right. You can also click an item in the list to display a red frame in the recognition area.
Create an edge image with cv2.Canny () from the cv2 image created with cv2.imread (), extract the contour from the edge image with cv2.findContours (), and convert the contour to an approximate polygon with cv2.approxPolyDP (). Convert and recognize cells. Since the cell is a quadrangle, if there are 4 polygon points obtained by cv2.approxPolyDP (), it is judged as a quadrangle. The coordinates x, y of the quadrangle and the vertical and horizontal dimensions w, h are as x, y, w, h in the code below.
cv2_image = cv2.imread( str(filename) )
gray = cv2.cvtColor(cv2_image, cv2.COLOR_BGR2GRAY)
edge = cv2.Canny(gray, 1, 100, apertureSize=3)
kernel = cv2.getStructuringElement(cv2.MORPH_RECT, (3, 3))
edge = cv2.dilate(edge, kernel)

contours, hierarchy = cv2.findContours(edge, cv2.RETR_TREE, cv2.CHAIN_APPROX_SIMPLE)

approxes = []
for contour, hierarchy in zip(contours, hierarchy[0]):

    area = cv2.contourArea(contour)
    if not area_range[0] < area < area_range[1]:
        continue

    approx = cv2.approxPolyDP(contour, 0.01*cv2.arcLength(contour, True), True)
    if len(approx) == 4:
        approxes.append(approx)

rects, crops, crop_images = [], [], []
for approx in approxes:

    p1, p3 = approx[0][0], approx[2][0]
    x, y = p1[0], p1[1]
    w, h = p3[0] - p1[0], p3[1] - p1[1]
    rect =  [x, y, w, h]
Confirmation of recognition contents
If you check Edge, the edge-detected image created for cell area recognition will be displayed. If you check Detect rect, all the areas recognized as cells will be displayed in a blue frame, and if you check Crop rect, the areas in the cell that recognize characters will be displayed in a green frame.
Cell recognition settings
Adjusted contour_area_range to be able to limit the area of the rectangle recognized as a cell. By judging this area, you can exclude too large rectangles such as the outside of the table and too small rectangles contained in the characters.
Split cells to display in table
Click Recognition to recognize the table, then click Split cells to display the cropped image in the table.
Source code
Uploaded to [github] (https://github.com/ymtlab/table_recognition_with_opencv_and_pyqt5/tree/daf1f1df7755046cddd10ab6c7b651dc54dfd36f)